Description
Product features
Product type
Number of digits
Liquid crystal display
Key characteristics
Key functions
Memory
Power supply
Size (D × W × H)
Weight
Accessories
Warranty period
Net Quantity
Pakistan Product Code
Country Of Origin
Display format settings
Basic calculation
Advanced calculation
Applied calculation
Financial calculation
Basic functions
Other functions
Physics- and chemistry-related functions
Statistical data
Statistical calculation
Statistical graphs
Basic graph function
Graph application function
Geometry function
Calculator program function
Program capacity
Permitted in exams
Exam-mode compatible
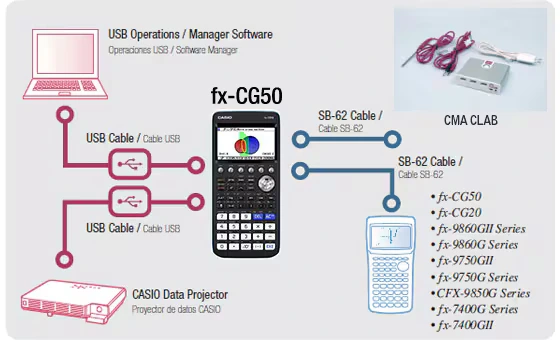
Connection to peripheral devices
Features
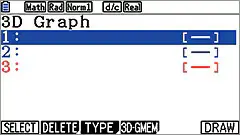
3D Graph
3D graph types
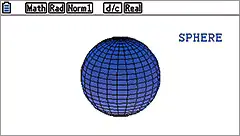
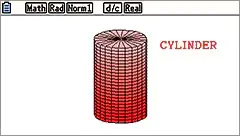
Four types of 3D graphs (Sphere,Cylinder,Plane and Line) are available. It is easy to draw 3D graphs using templates.(An industry-first feature)


Draw and display up to three 3D graphs
Recognize combinations of graphs and interactive relationships between two or three graphs mathematically.
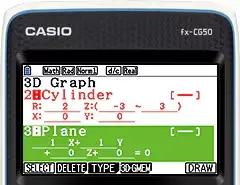
Three expressions available

Cylinder and plane expressions

Cylinder and plane graphs
Investigate the relationship between expressions and 3D graphs

Expression
3D graph
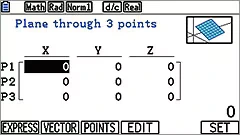
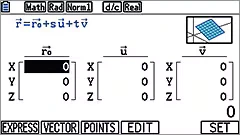
Select EXPRESS, VECTOR or POINTS format when in putting expression of 3D graphs.

EXPRESS
VECTOR FORMAT
POINTS FORMAT
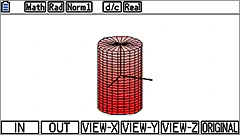
Explore 3D graphs mathematically
① Zoom in and zoom out
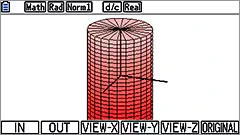
Zoom in

Zoom out
② Vertical and horizontal rotation
Vertical rotation

Horizontal rotation
③ Cross section

④ X-axis,Y-axis, Z-axis view

Z-axis view
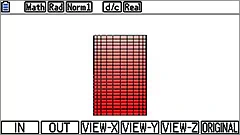
X-axis view
E-CON4 Application
This feature, with a simple user interface, is effective for collecting data for use in classroom science and technology lessons.

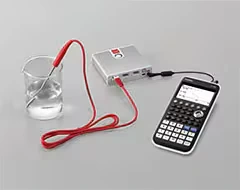
This feature has Auto-ID recognition, which enables drawing of graphs of collected data automatically with no complicated settings.
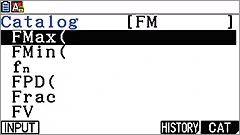
Catalog Function
Select the desired command easily and quickly use the catalog function.

Category search
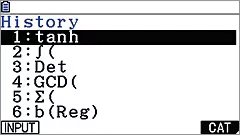
History search
History search
Examination Mode
This mode allows you to quickly prepare your calculator for exams. This mode restricts access to memory, programs, functions and applications, so that these features would not be available during exams.

Enhance your lesson plans by linking the calculator to various devices.
Peripherals
Software (Manager)
Manager is a software program that emulates the operation of Graphing calculator fx-CG50. This enables teachers to prepare teaching materials (Activities) and present them in the classroom using a projector (Workshops).
Subscription Methods
There are two ways to subscribe: online or card.
fx-CG Manager PLUS Subscription
for fx-CG Series
• fx-CG50 Calculator Emulation
for Windows
for Mac

fx-CG Manager PLUS Subscription for fx-CG20 Series license can utilize
fx-CG Manager Subscription for fx-CG50 Series with the same lisence
Licensing Opions

Card
License expiration period 1 year
• FA-CG1SA(Single License)
• FA-CG1SB(10 Licenses)
• FA-CG1SC(30 Licenses)
• FA-CG1SD(100 Licenses)

Online
License expiration period 1 year
• FA-CG-1-W1A(Single License)
• FA-CG1-W1B(10 Licenses)
• FA-CG1-W1C(30 Licenses)
• FA-CG1-W1D(100 Licenses)
License expiration period 3 years
• FA-CG1-W3A(Single License)
• FA-CG1-W3B(10 Licenses)
• FA-CG1-W3C(30 Licenses)
• FA-CG1-W3D(100 Licenses)
Basic Functions
• Angle unit, Angle unit conversion (Deg, Rad, Gra)
• Trigonometric functions, Inverse trigonometric functions
• Hyperbolic functions, Inverse hyperbolic functions
• Exponent functions, Logarithmic functions
• Power functions (square root, cubic root, square, power, radical root)
• Coordinate conversion (Pol, Rec)
• Combination/Permutation (nCr, nPr)
• Factorial, Inverse, Random numbers, Random sampling of an existing list, Fractions
• Logical operations
• Sexagesimal ↔ Decimal conversion
• Matrix calculations
• Vector calculations
• Complex number calculations
• Base-n calculations/conversions
• List data calculations
• Rounding
• Display format
• Conversion (pre-installed software)
• Engineering symbol calculation
• Engineering notation
Graphing
• 3D Graph (pre-installed software)
• Rectangular coordinate graphing,Polar coordinate graphing
• Integration graph
• Parametric function graphing, Inequality graphing
• Trace, Zoom (box zoom, zoom in, zoom out, auto zoom)
• Table and Graph
• Dual Graph (table and graph, graph and graph)
• Sketch (tangent line, normal line, inverse function)
• Solve (root, minimum, maximum, intersection, integration: integral calculation improvement (real-time integral calculation), new integral calculation function (mixed integrals))
• Dynamic graph
• Conic section graph
• Recursion graph
• Picture Plot (pre-installed software)
Statistics
• List-based one-variable and two-variable statistical analysis
• Statistical regression calculations
• Statistical plot (scatter plot, xyLine, normal probability plot, histogram, box plot)
• Statistical regression graphs (linear, med-med, quadratic, cubic, quartic, logarithmic, exponential, power, sinusoidal, logistic regression)
• Advanced statistical calculations: tests (Z-test, t-test, χ²-test, F-test, ANOVA), intervals (Z-interval, t-interval), distributions
• Pie chart
• Bar graph
Hardware
• Power supply : Four AAA-size alkaline batteries or four nickel-metal hydride batteries
• Approximate battery life (hours) : 140 (AAA-size alkaline batteries), 85 (nickel-metal hydride batteries) Assuming 5 minutes calculation and 55 minutes display per hour
• Dot matrix display : 216 x 384 dots
• Display capacity (characters) : 21 x 8
• Internal operation digits : 15
• Nested parentheses levels : 26
• Data communication : 3-pin cable, USB cable
• 3-pin serial port
• USB port